deviceTRUST Diagnostics (dtdiag.exe)
All deviceTRUST components (Host and Client) have product diagnostic features built-in to analyze the product during runtime or to create product log files for the deviceTRUST support team to analyze product behavior. When the deviceTRUST host and client are used together, it is important to capture log files from both the host and client during the same session, enabling a complete picture of the behavior of the system to be captured. The deviceTRUST diagnostics tools captures a lot of log statements from the product. Minimizing the number of steps performed whilst logging is enabled will ensure a speedier diagnosis.
- The deviceTRUST diagnostic tool must be launched with administrative privileges to the local system. However, when reproducing the problem, please ensure that the client continues to be run using the same account and privileges which had previously exhibited the symptoms.
deviceTRUST Host Diagnostics
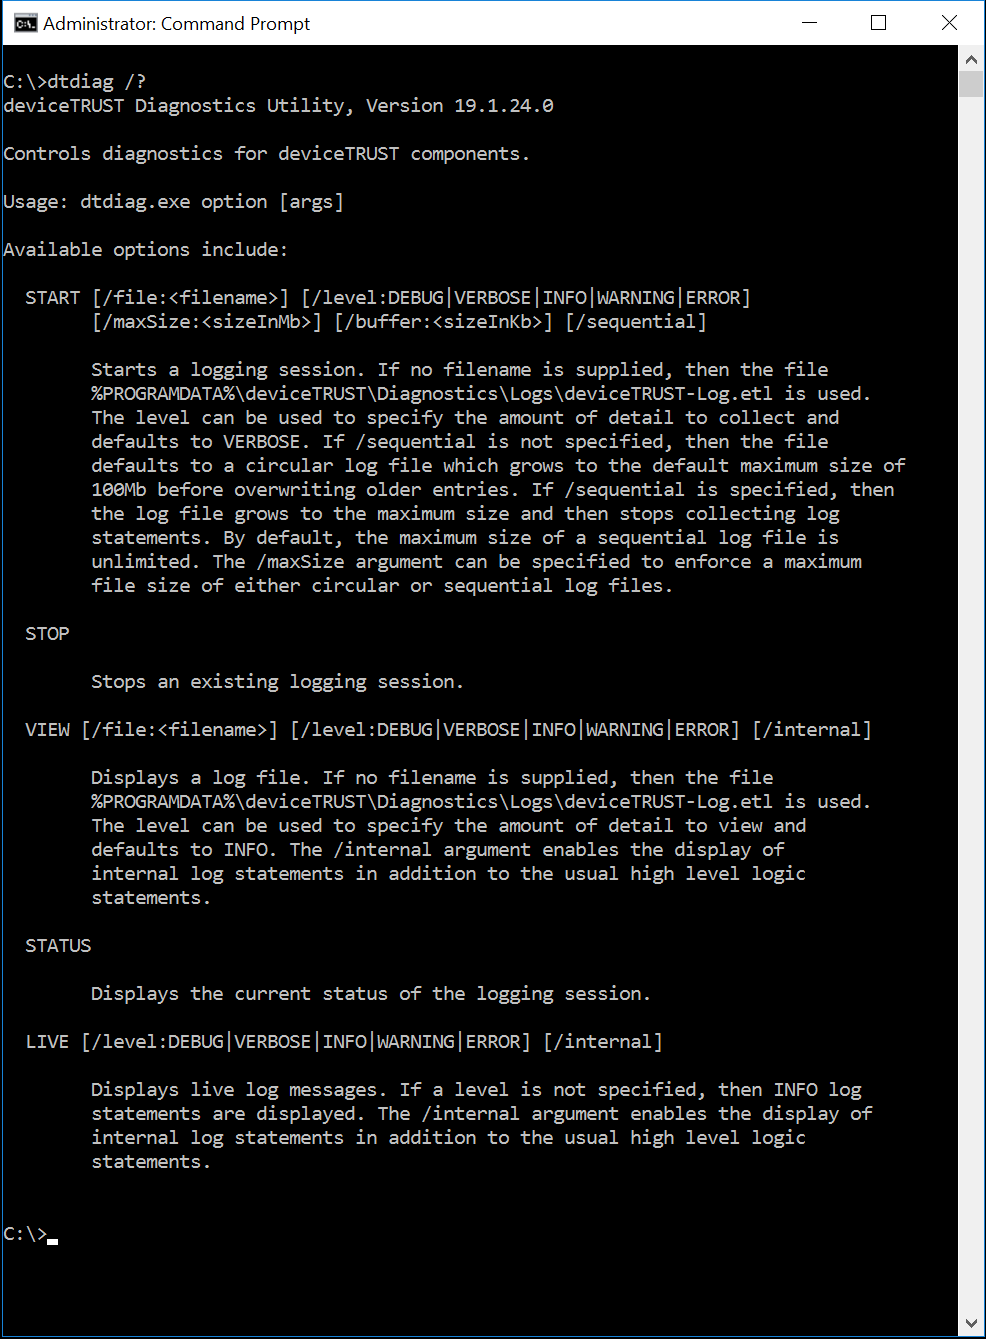
The deviceTRUST Host diagnostic tool DTDIAG.EXE can be found under the following path: %PROGRAMFILES%\DEVICETRUST\HOST\BIN and has the following command line parameters:

To create a deviceTRUST Host debugging file you need to:
- Start the deviceTRUST Host debugging mode:
DTDIAG.EXE START C:\DTHOST-DEBUGFILE.ETL - Recreate the issue, preferably using the minimum number of steps necessary
- Stop the deviceTRUST Host debugging mode:
DTDIAG.EXE STOP
The final deviceTRUST Host debugging file can be compressed using your favorite compression tool and then sent to the deviceTRUST Support Team for analysis, along with a detailed description of the symptoms.
deviceTRUST Client Diagnostics
The deviceTRUST client diagnostic tool DTDIAG.EXE can be found under the following path: %PROGRAMFILES%\DEVICETRUST\CLIENT\BIN and has the following command line parameters:

To create a deviceTRUST Client debugging file you need to:
- Start the deviceTRUST Client debugging mode:
DTDIAG.EXE START C:\DTCLIENT-DEBUGFILE.ETL - Recreate the issue, preferably using the minimum number of steps necessary
- Stop the deviceTRUST Client debugging mode:
DTDIAG.EXE STOP
The final deviceTRUST Client debugging file can be compressed using your favorite compression tool and then sent to the deviceTRUST Support Team for analysis, along with a detailed description of the symptoms.
